Other Important Scans in KeyStocks
Analysis Search Menu
Breakout Analysis
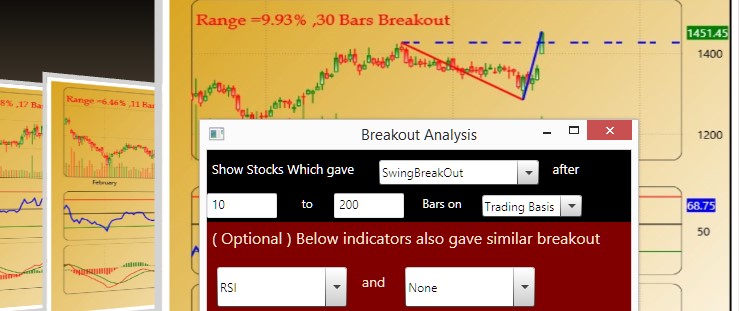
Breakout Scan can find stocks who broken previous swings high - low. This is a unique scan which doesn't restrict the user to find 'N' number of bars instead it facilitates user to find breakout / breakdown of any bars of certain range. For example -> Any breakout between 10 bars to 300 bars.
Apart from Swing breakout, normal breakouts also possible in this scan
Optional feature of Indicator breakout is also available so that user can avoid stocks where price breakout has not happened with divergence in indicators like RSI - MACD
Scan Divergence
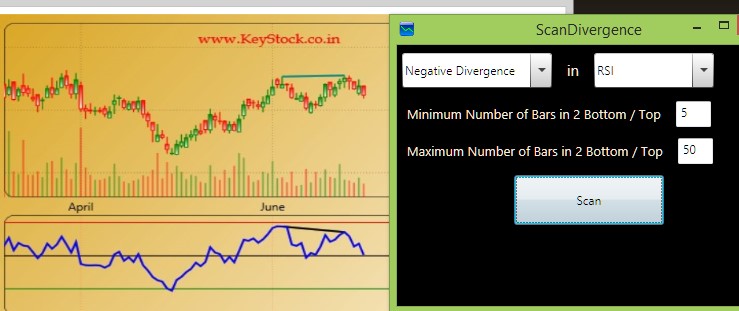
Divergence scanner help users to find out positive and negative divergence in indicators like RSI and MACD. It shows chart images with clearly visible divergence indications with the help of trendlines as visible in above image.
Users can also set size of swing for divergence for example if some user wants divergence on small swing than he can set range of 5 and 10 bars or if user wants on divergence on bigger swings then he/she can set range of 20 and 100 bars
52 Week High Low
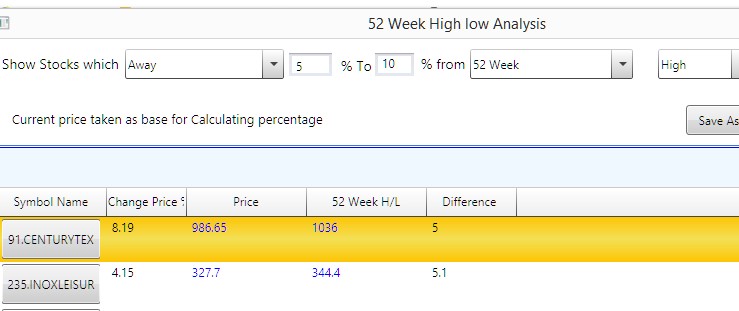
This scan can give list of stock which are trading near to 52 week high / low by some percentage for example 5 to 10 %. Other option in this scan gives a list of stocks which has rebounded from 52 week high / low by cetain percentage like stocks which has rebounded 50 % to 60 % . This example means if stock has made 52 week low of RS. 100 then after making this low of 100 , stock has now trading between the price range of 150 to 160 (50 to 60 % ).
Volume Analysis
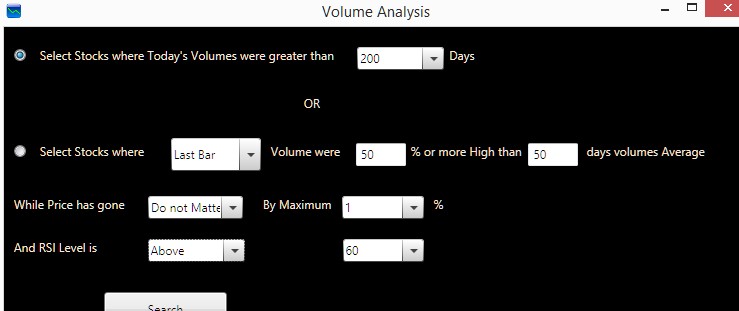
Volume Analysis Scanner not just filter stocks where volume is high but also facilitates to filter placement with help of RSI. For example, user can scan stocks where volume is 200 % more than Avg volumes and RSI is below 30 or say above 70. It helps to differentiate between accumlation and distribution.
User can also scan stock where volume is highest among last 200 days or even lifetime highest volume.
Higher High - Higher low / Lower Low - Lower High Scan
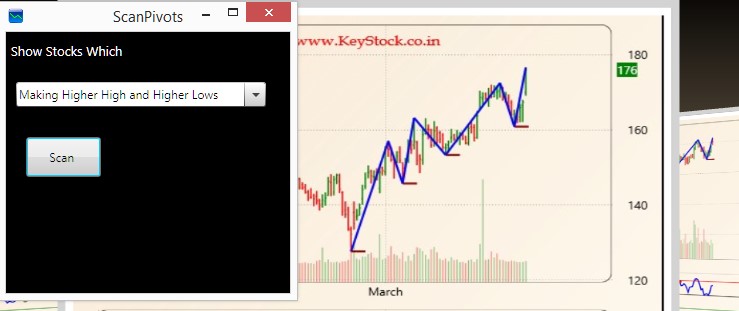
Dow Theory suggests that if stock is making higher highs - higher lows than it is considered as stock is in uptrend and if stock is making lower highs - lower lows than it is considered as stock is in downtrend.
This scanner can scan stocks which making higher highs - higher lows / lower highs - lower lows or even stocks which made first higher high - higher low and vice a versa.
Price Volume Analysis
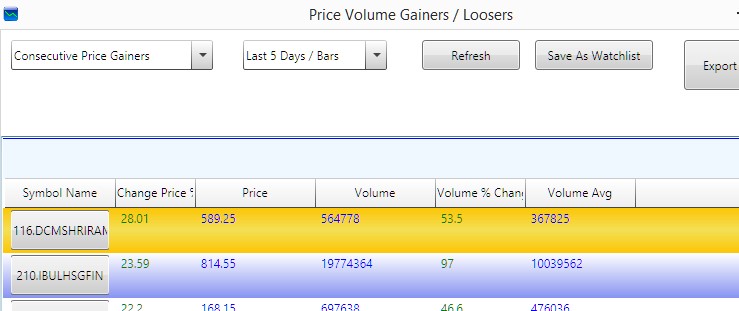
This is most basic yet popular scan. It can find Consecutive Price Gainers / loosers upto last 5 bars and also volume gainers.
Weekly and Monthly Pivot Point

Pivot point is most commonly used tool by traders. It can scan weekly and monthly pivot / Resistance and Support break.
It can scan 4 types of pivot points - Classic, Woodies, Camarilla and Fibonacci Pivot points.
Apart from break, it can also scan stocks which took support or found resistance at Pivot points.
Closing Analysis - High low breakout
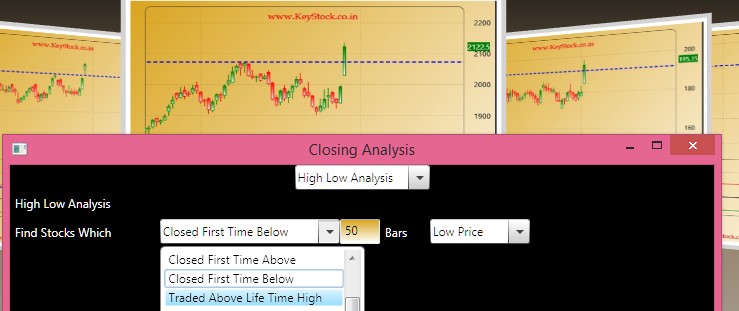
This scan has multiple option to scan for High low breakouts like broken lifetime high low / 52 week high low / last year , quarterly , monthly high low or even customized last 'N' number of bars high low.
Gaps Analysis
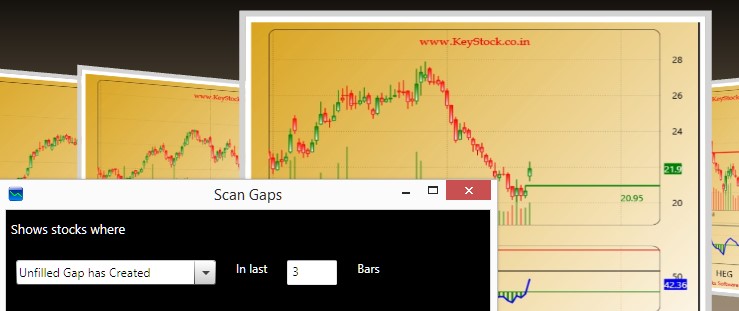
This scan can filter stocks has made gap (up or down) in last 'N' number of bars.
It can also scan stocks where gap was created in past but now stock has retraced back and that gap has been filled in last 1 to 3 days.
Range Bound Analysis
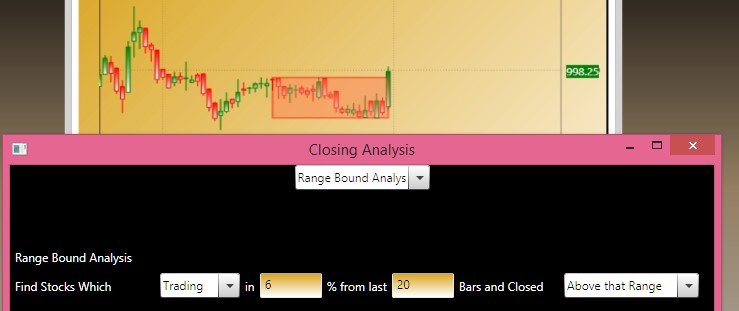
This scan can help in finding stocks which are trading in certain range from last N number of days and now it has broken that range. It also has optional feature to find stocks which is still in that close range and not broken yet.
Fibonacci Retracement
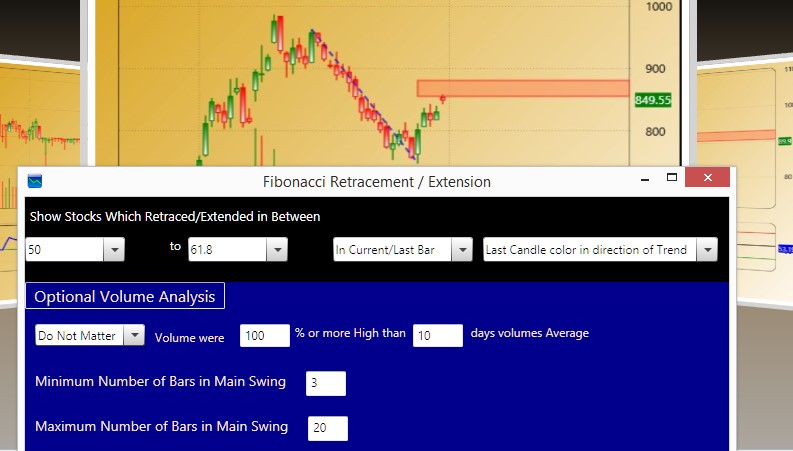
This scan is a gem for trader who follow Fibonacci retracement frequently in trading. It can scan stocks which has retraced to a certain percentage like 50 % , 61.8 % , 78.6 % or any other percentage entered by user choice.
It has multiple optional features where user can filter like color of the last trend should be in direction of the main swing , High volumes and size of swing can also be filtered with lots of flexibility.