Indicators available in KeyStocks
With Flexible Scans
Ichimoku Kinko Hyo
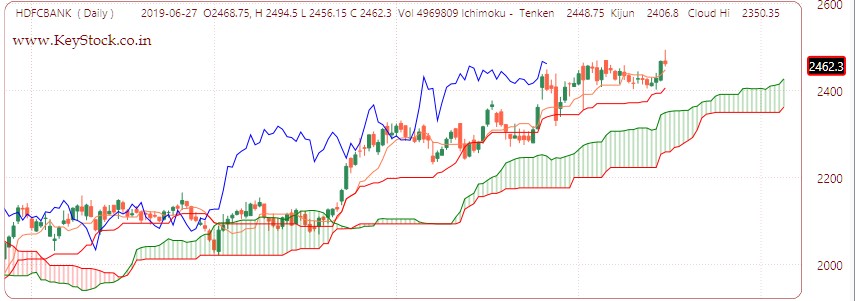
Ichimoku is one of the most popular indicator these days and KeyStocks-Lite is beloved tool among Ichimoku followers as it have flexible scan features for Ichimoku cloud as well as Tenken-sen and Kijun-sen.
SuperTrend
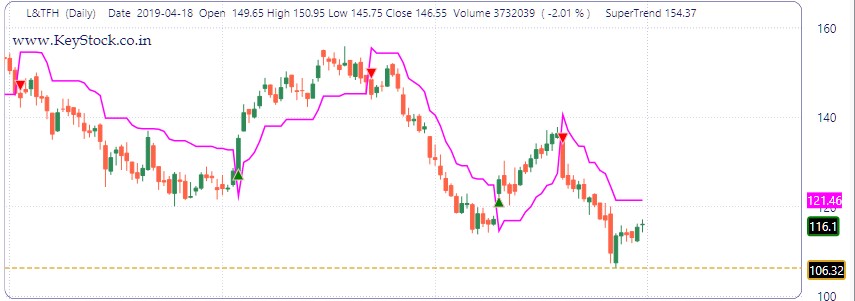
Multiple scan available for SuperTrend indicator like Buy Signal -> When price closes above line, Sell signal -> When price closes below line or when price touch supertrend line.
Scans available in Analysis Search Menu -> Search Signal option and also in Build Custom Query option
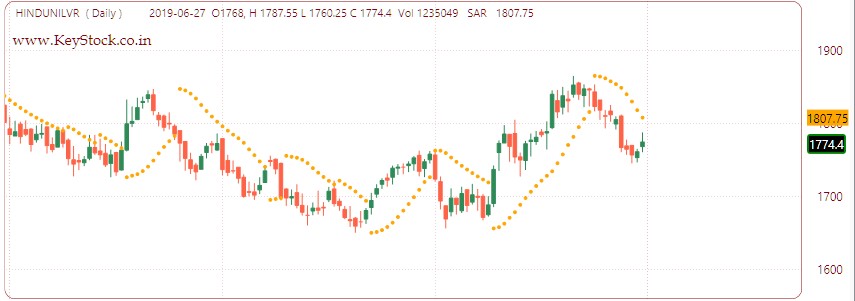
ATS/SAR
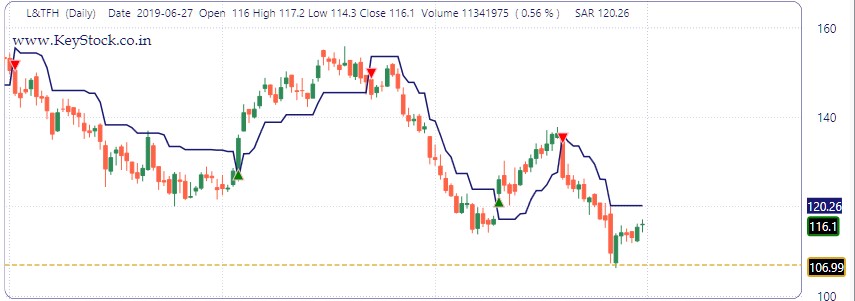
ATS/SAR is very much similar to supertrend indicator, only minor difference is in its calculation. By default is is plotted on Tab1 in software.
SAR Special
SAR Special indicator is mix of 3 indicators i.e ATS / SAR + Phase + KeyTrend. When all these 3 indicator gives bullish indicatotion then Sar Special gives bullish signal and vice a versa. Video is available here youtube.com/watch?v=rlS7nauuxzw to explain SAR special as well its 3 ingredients.
Scan for Sar Special is available in Custom Query Menu -> Build Custom Query option -> Search Signal option.
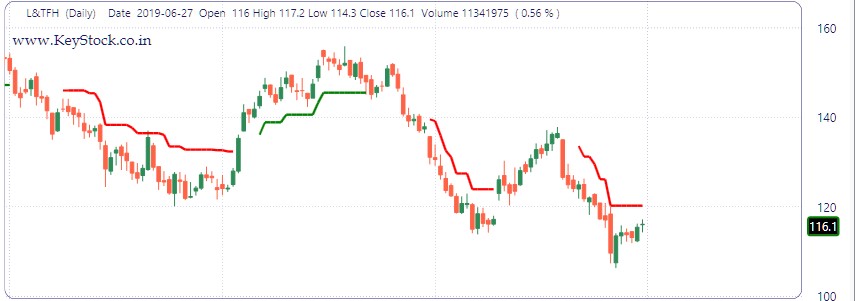
Parabolic SAR
Parabolic SAR also referred as PSAR is universal indicator. Functionality is simple when dots appear below candle stock is termed as bullish and vice a versa
Scan for PSAR is given in Build Custom Query option.
HL SAR
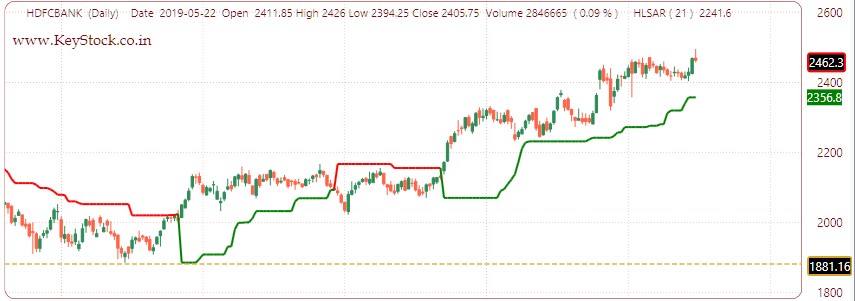
As the name suggest it is based on High-Low values of last 'N' bars. Default parameter is 21. When highest high price of last 21 bar is breached, this indicator gives bullish indication and vice a versa. Which means lowest low price of last 21 bar is breached than it gives bearish indication.
HL SAR is also always in trade indicator based on Support and Resistance (SAR) line. Representation of HL SAR is similar to supertrend.
Scan option is available in Build Custom Query option and in Analysis Search Menu -> Search Signal option.
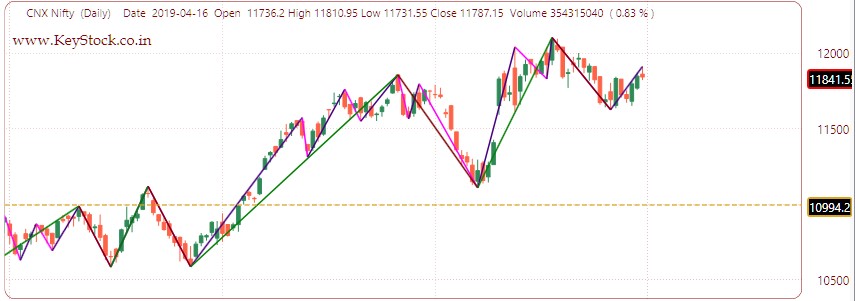
Auto Trendlines
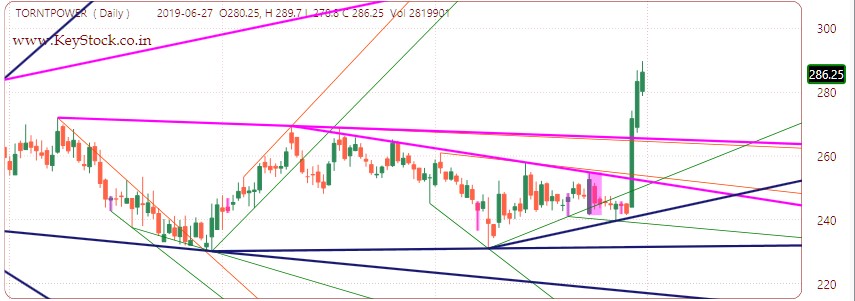
Trendlines are plotted by connecting swing highs or swing lows. Sometimes trendlines connecting small swings are relevant while sometime trendline connecting bigger swings are more relevant. In KeyStocks user can plot Auto Trendlines indicator with different parameter.
Lower parameter value stands for small swings and thinner trendline while higher parameter value stands for bigger swings and thicker line.
In Tab 9 , Auto trendline is plotted with parameter of 9 (thicker line) and 3.
.
Pivot Levels
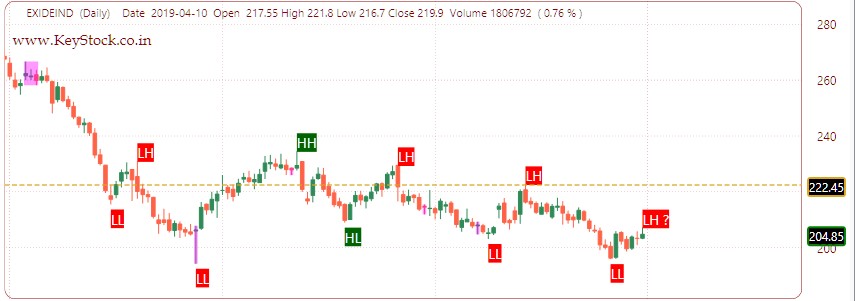
Higher High and Lower lows can be plotted automatically on chart with help of indicator named 'Pivot Levels' and also with 'TL_Pivot'. These indicators too have parameter for customization. Scan is also available for stocks making HH-HL or LL-LH
Zig Zag
Zig-Zag indicator is plotted by connecting swing high and swing low. Swings are based on "N' number of bars high and low.
This indicator is very useful for price action trader as well as elliott wave follower. User can plot more than one zig-zag with different parameters to find out small as big swings.
Gann Swing
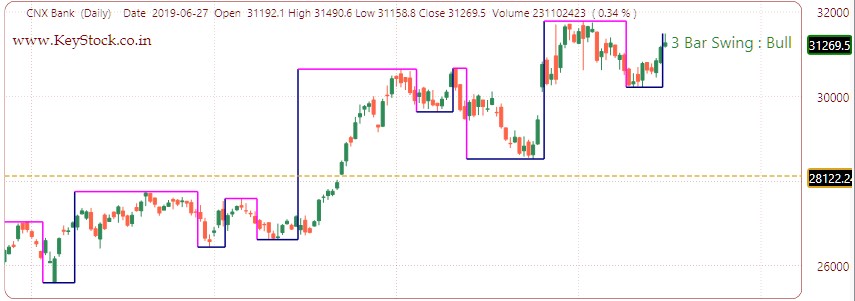
Gann Swing is very much like zig-zag indicator only difference is its calculation, which is based Gann concepts.
If stock is making higher-high then it will show as Bullish and vice a versa.
BB Squeeze
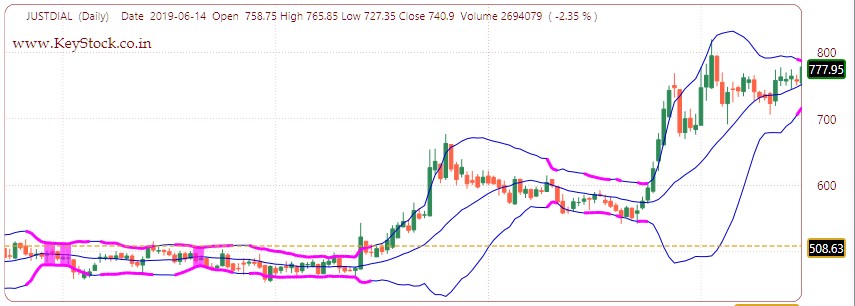
As the name suggest it reflect squeeze of Bollinger band. BB Squeeze shows total 3 different type of squeeze
1) When Kelter Channel is Inside BB Band -> Top and Bottom line of BB Band changes color to magenta
2) When width of BB band is lowest of last 200 bars -> Vertical lines b/w high and low of BB band drawn to show shaded area , here color is peach or say some shade of pink
3) When Both of above conditions are satisfied at same time -> Shaded area is also magenta in this case.
Scan available for BB Squeeze is available in Analysis Search Menu -> Scan Indicator Option -> Upper Indicator / Layout .
Fibb Bands
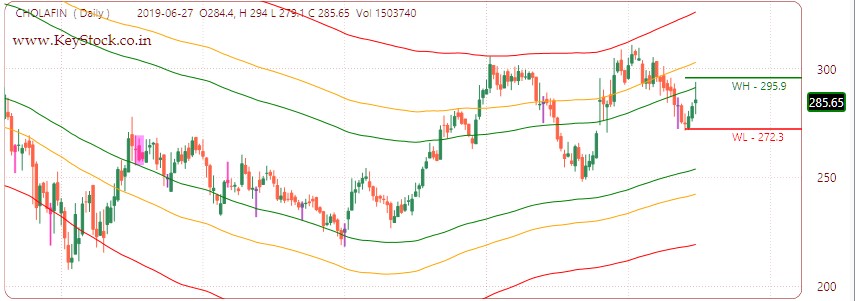
Total 6 lines are plotted in Fibb bands and they are divided into two parts i.e Upper Band (Top 3 lines) and Lower band (Bottom 3 lines).
When Stock price enters in upper band it indicates bullish and when it enters lower band it indicates bearish scenario.
If slope of the Fibonacci Bands bands are pointing to the upside than long opportunity can be considered and vice a versa when Fibonacci Bands bands are pointing to the downside.