Scan Chart Pattern
Explore stocks with powerful chart pattern recognition scanner
You can Scan stocks in which below chart patterns have emerged. New patterns will be added soon in this arsnel. It is commonly said that novice traders trade with only Indicators while experienced traders first filter stocks with Price Action and then apply indicators. These price action is monitored through trendlines, channels and more often these channels may take form of some chart patterns.
Very few software support chart pattern scan, and most of such software shows patterns in their scans once they are formed while Keystocks chart pattern screener shows you such patterns much before the time they are fully formed which enables users to trade accordingly with smart investors.
Available Chart Pattern Scans
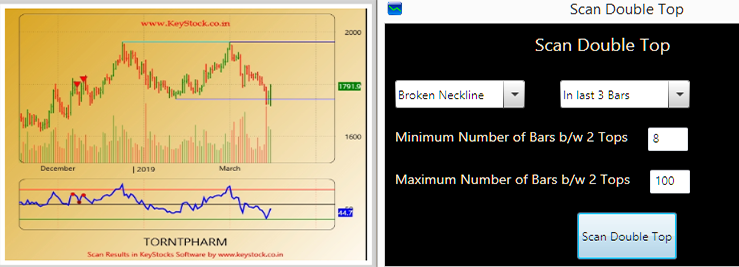
1) Double Top Pattern : Sometimes called an "M" formation because of the pattern it creates on the chart, the double top is one of the most frequently seen and common of the patterns.
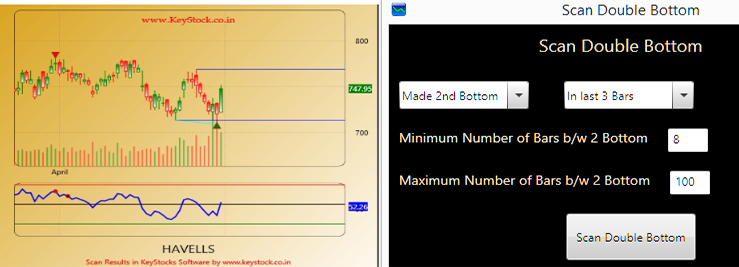
2) Double Bottom : This pattern is just reverse of double top pattern and often called as "W" pattern. This is also one other most frequently seen and common pattern.
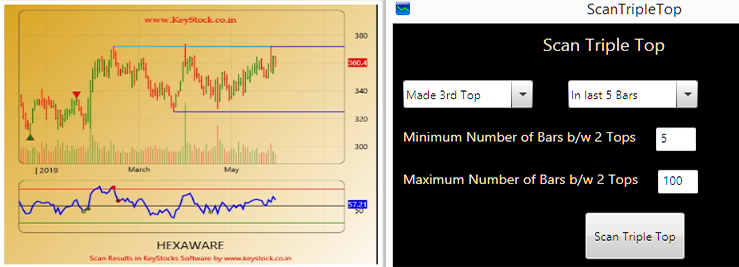
3) Triple Top Pattern: Often act as a resistance level for stocks and most of the times it is broken on the downside.
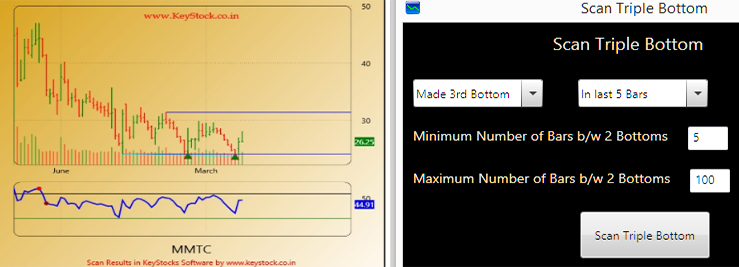
4) Triple Bottom Pattern:Just Opposite of Triple top pattern and many times acts as support zone for stocks.Expert traders buy stocks near this support zone if other technical indicators are supporting while new to technical analysis enters on breakout.
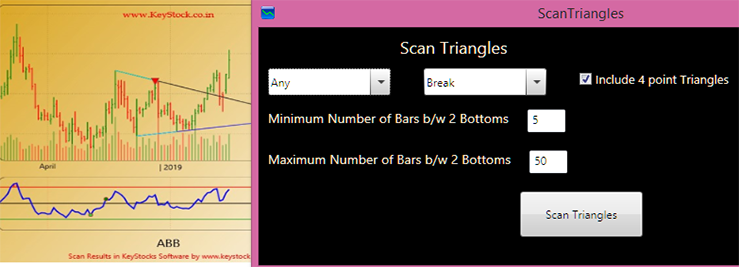
5) Triangles: Keystocks scan for 3 types of triangles Ascending , Descending and Symmetrical triangles. Minimum 4 points before breakout are required to make triangle pattern but longer the pattern better is result. One of most important requirement is High volumes on breakout which can not be ignored.
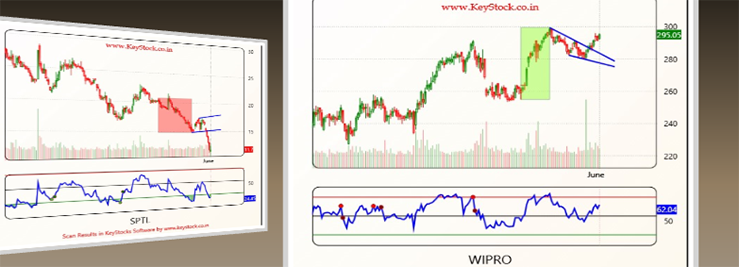
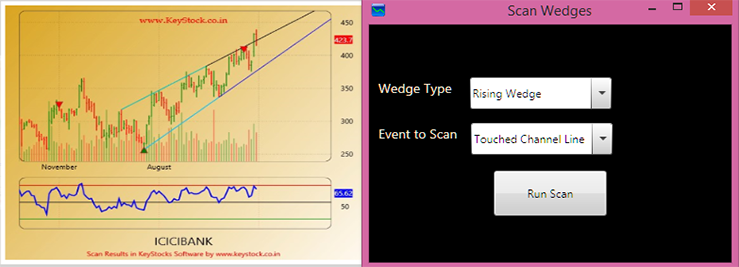
6) Wedges : Wedges formes when stock is make Higher High / Higher Lows in case of rising wedges and Lower high and lower lows in case of falling wedges. Upper Trendline and lower trendline must be converging like triangle but both lines should be sloping in same direction i.e Sloping Upward in rising wedge and sloping downward in falling wedge. Many times deadly pattern wolfe waves are also found while scanning for this patterns.
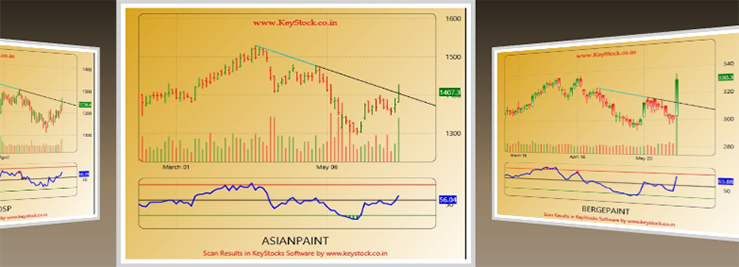
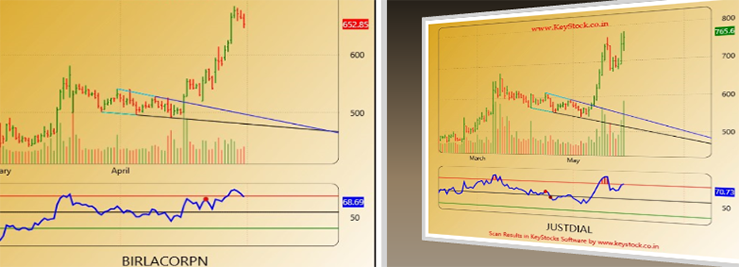
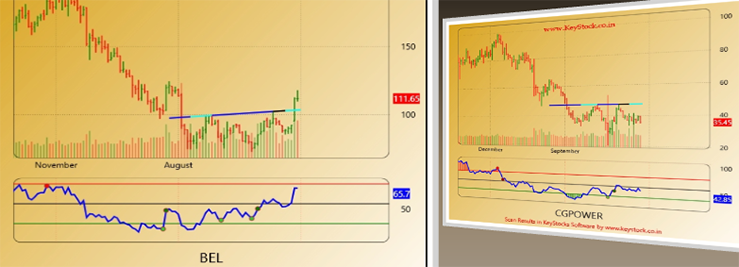
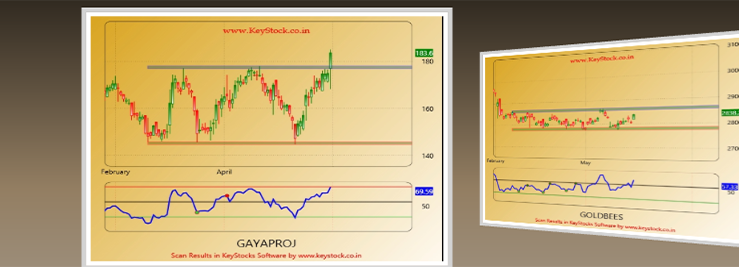
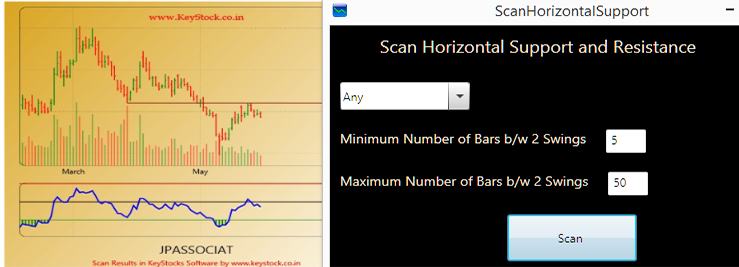
7) Trendline Scan : This is most useful scanning option in keystocks. Trend lines act as support , resistance , break down and breakout point for stocks. In addition to this all other chart patterns which are currently missing in our scan options can also be traced through this scan because every pattern has neckline in form of trendline which is required to break.
8) Wolfe Wave : Wolfe wave is refined form of 5 point wedges but with better symmetry. Here symmetry means number of bars in first swing (point A to C) and second swing (point C to E) should be somewhat equal. Volume must be high at point 5 to confrim Wolfe wave pattern.
9) Flag and Pennant : Flag and Pennant represent small consolidation after sharp rise / fall. Pennat is very similar to small triangle after good rise / fall in price and lines are converging in nature while in case of Flag trendline are not converging, they are more like very small channel. After formation of flag and pennant price is expected to move further in direction of original trend .
10) ABC Pattern : Zig- Zag after an up/down move. Part of elliot wave theory.
11) Head and Shoulder : It is reversal pattern. Head and Shoulders formation consists of a left shoulder, a head, and a right shoulder and a line drawn as the neckline. Most Important two factors should never be ignored. First one is prior trend, Prior trend means Bearish H&S should be formed after good upmove and vice a versa. Second important factor is volume must be high when price breaks Neckline
12) Rectangle Pattern : Minimum 6 points pattern connecting highs and lows where highs / lows are somewhat equal .